サステナビリティ
採用情報
お問い合わせ
最新情報一覧


朝日工業グループのパーパスは、
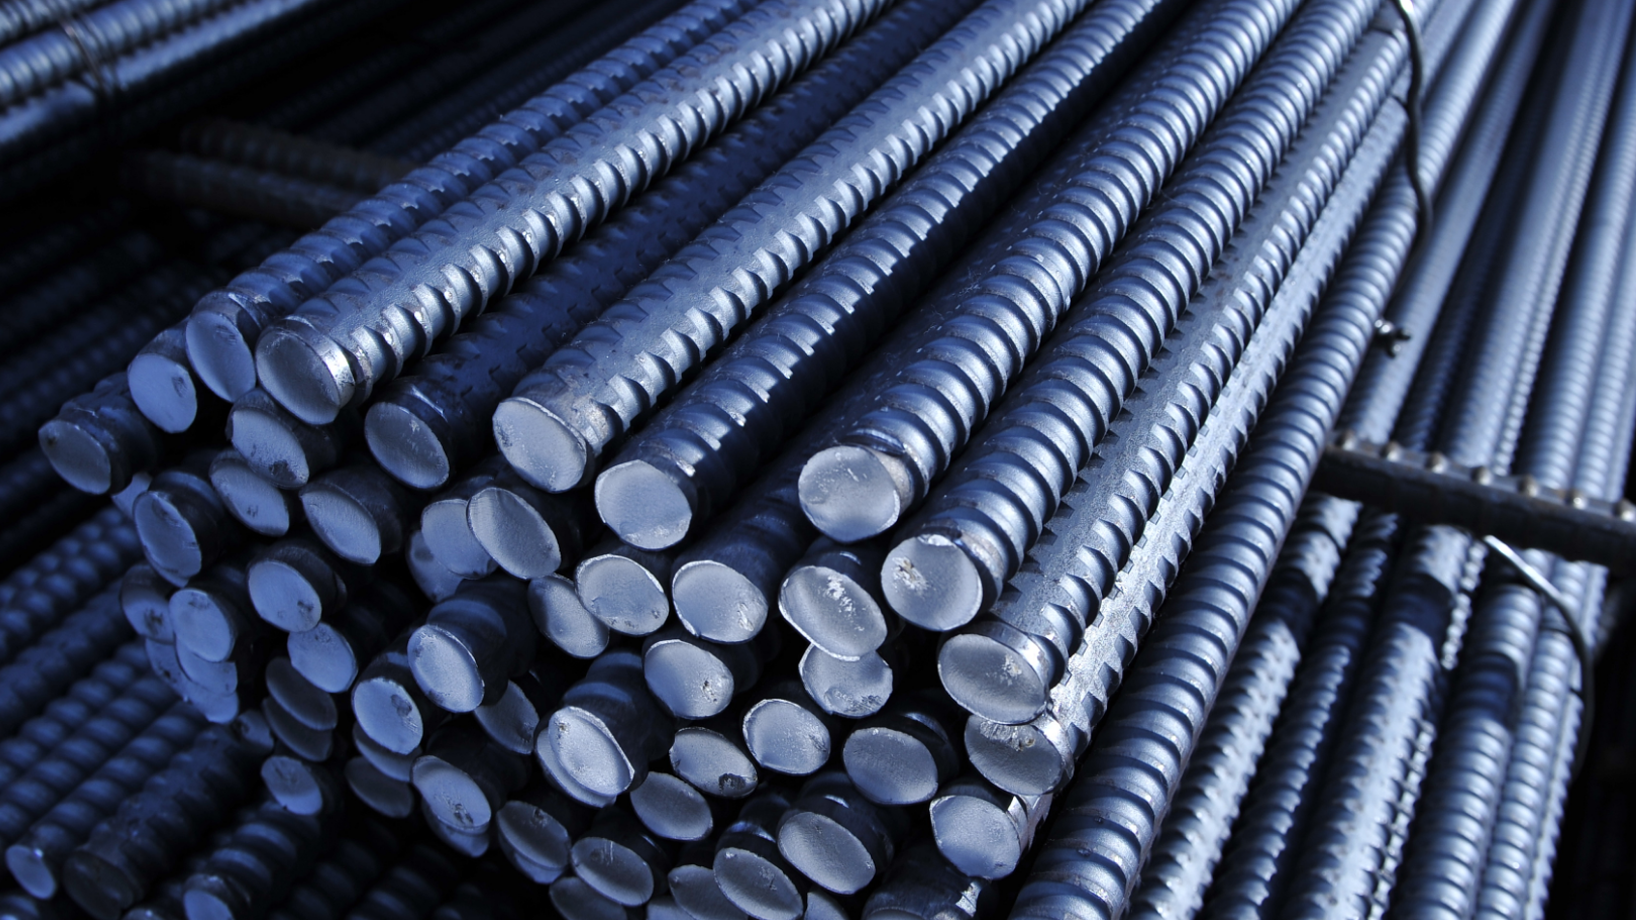
豊かで安心して暮らせる社会がこれからもずっと続くことを願い、資源の新たな可能性を創造するスペシャリストとして研究開発と技術イノベーションを推進し、「インフラ」や「食」を支える高品質の製品をお届けすることです。

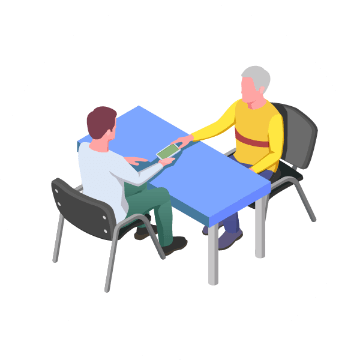
朝日工業グループで働く
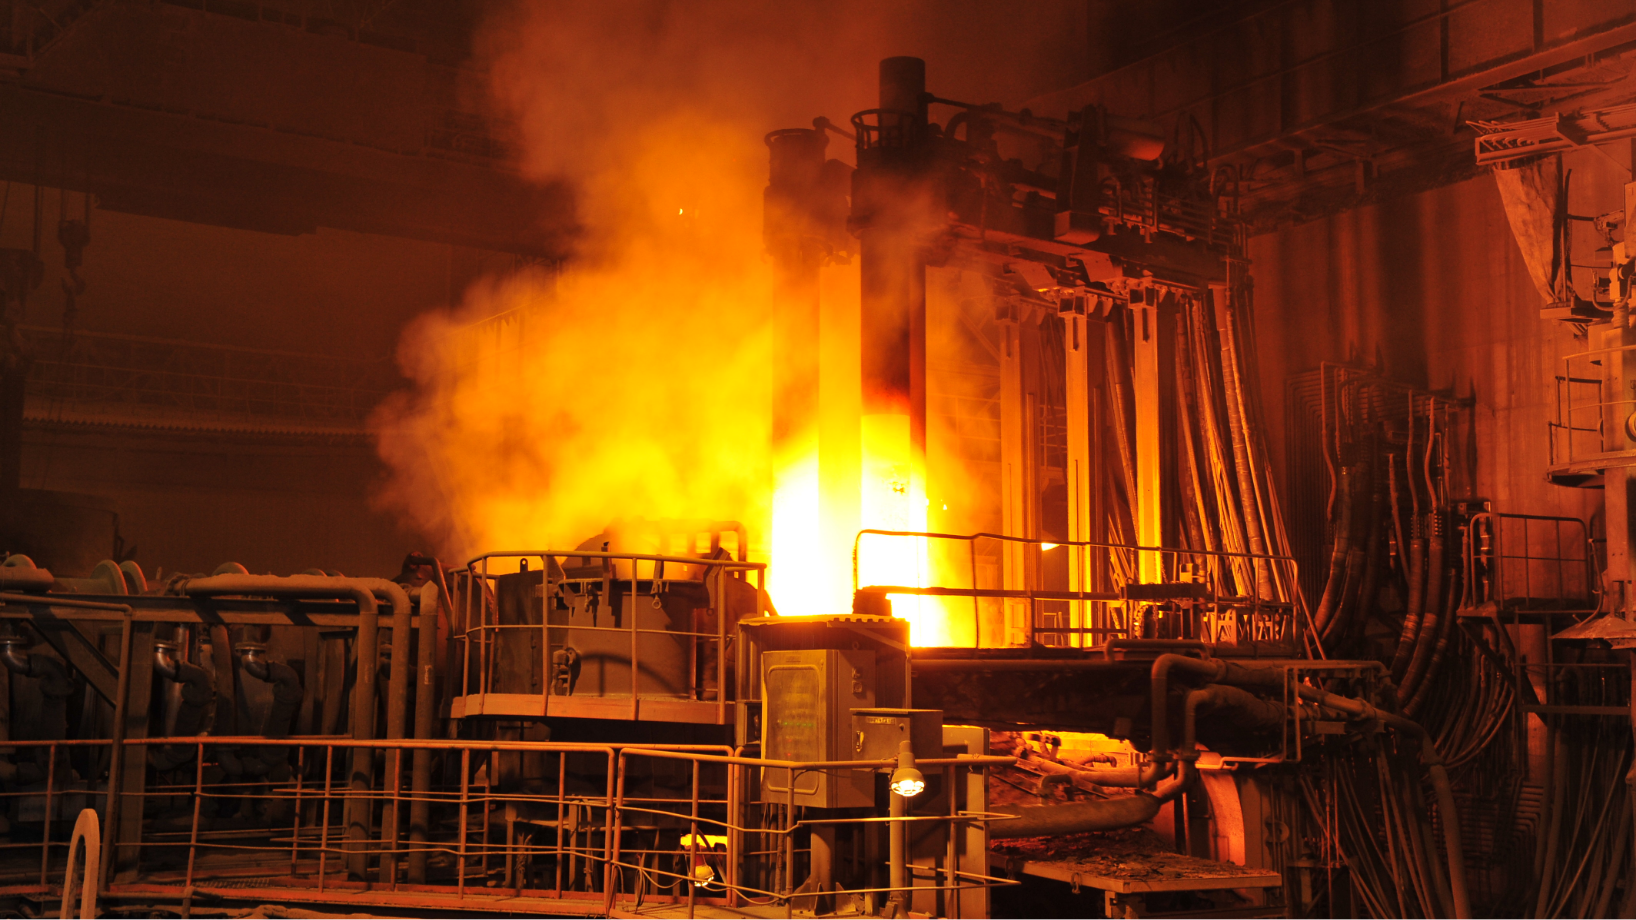
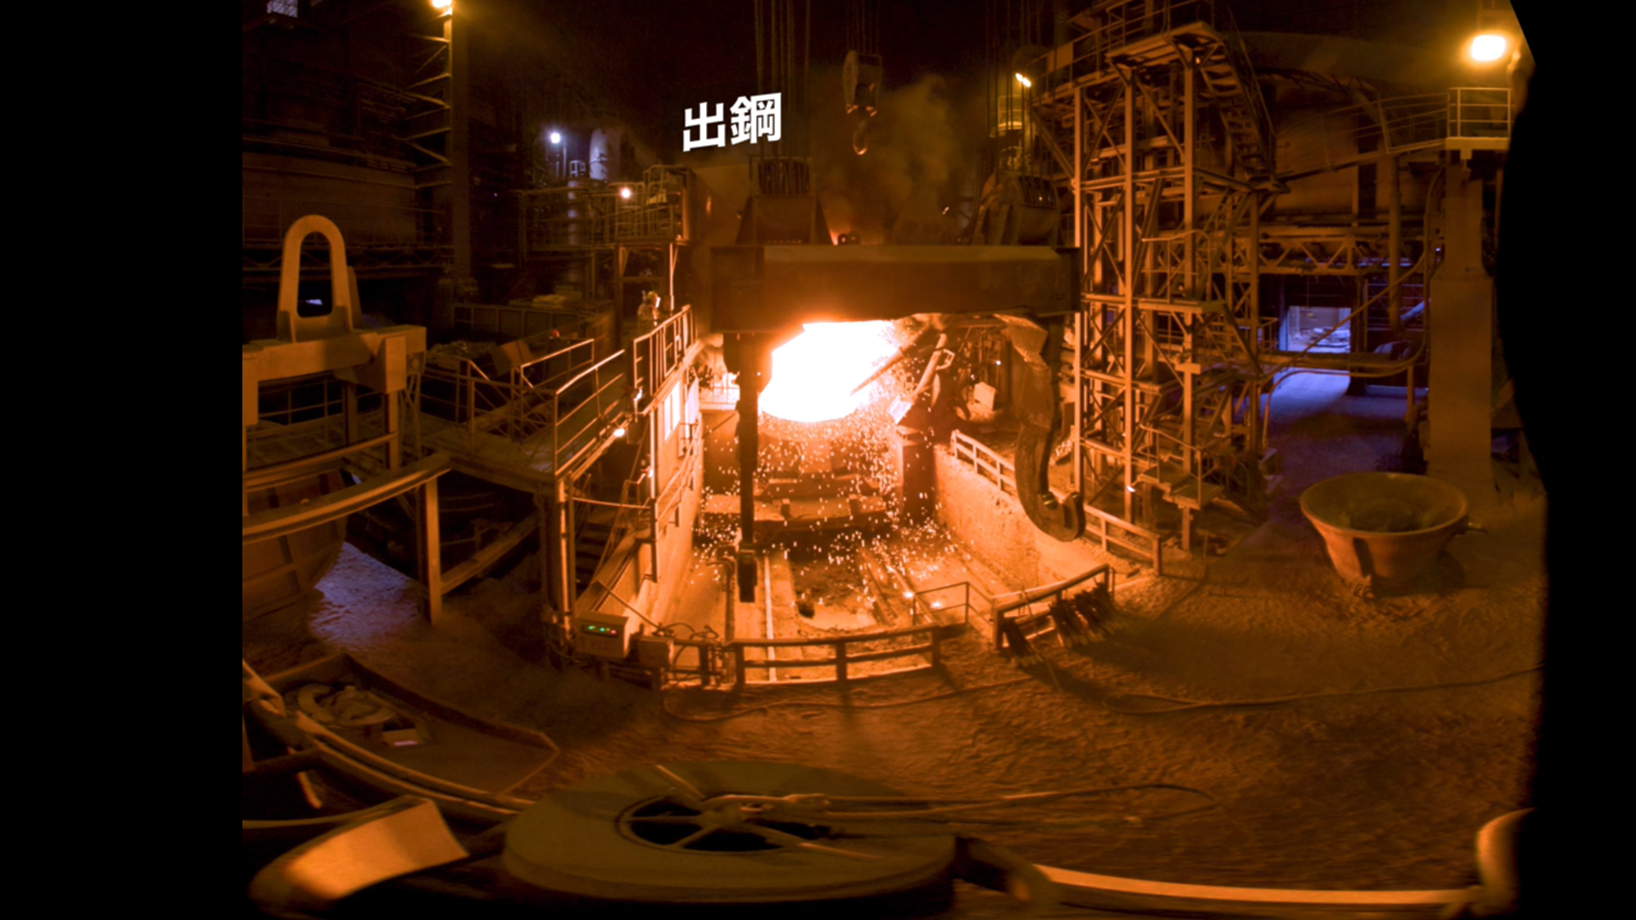
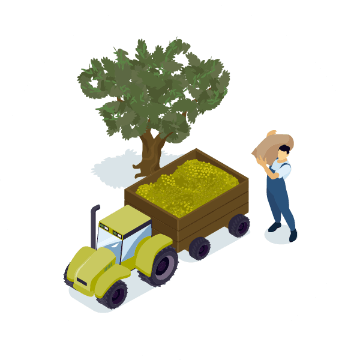
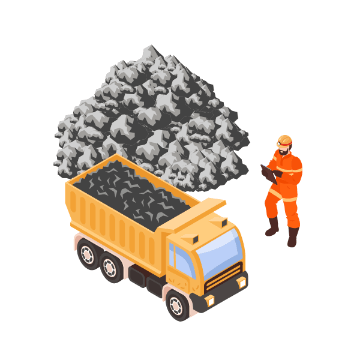
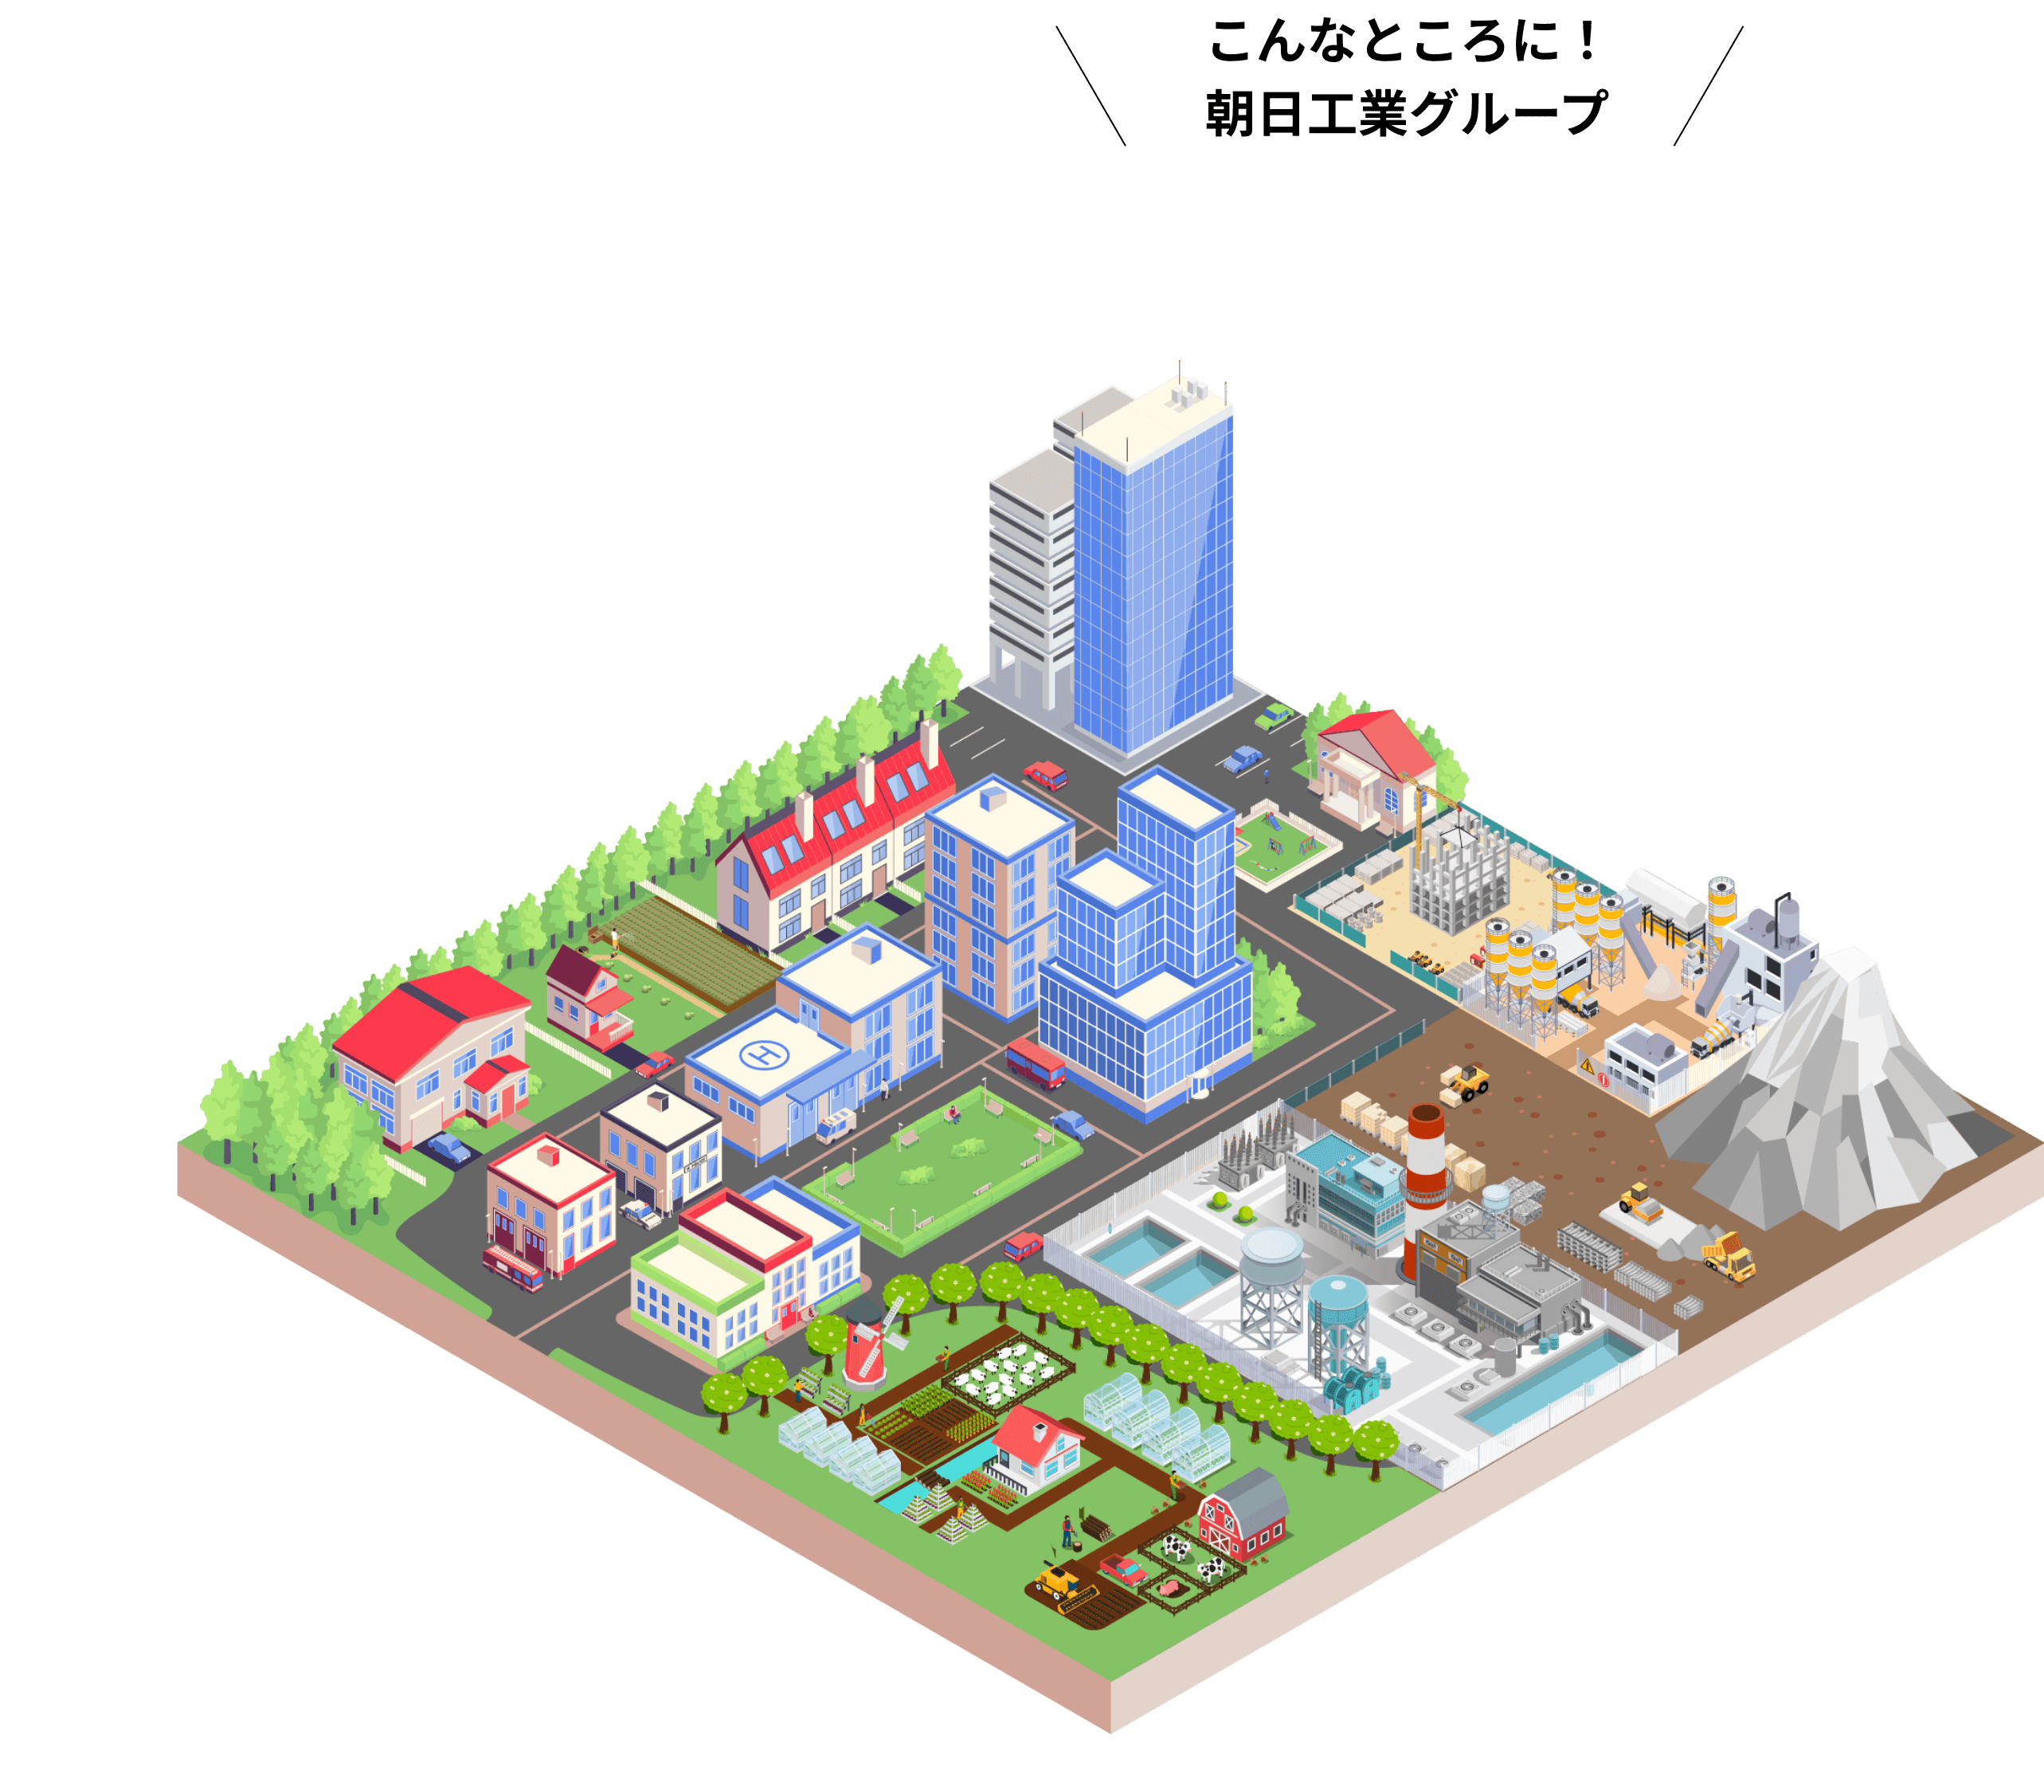
朝日工業グループは資源循環型社会の実現という目標に向かい、リサイクル、未利用資源の活用、限りある資源の有効利用に取り組んでいます。
「ものづくり」に対するこだわりが育んできた『高い技術』と『探究心』。それを更に発展させ、次世代に引き継いでいく。
循環型社会の担い手として私たちと安心して暮らせる未来を創りませんか?